
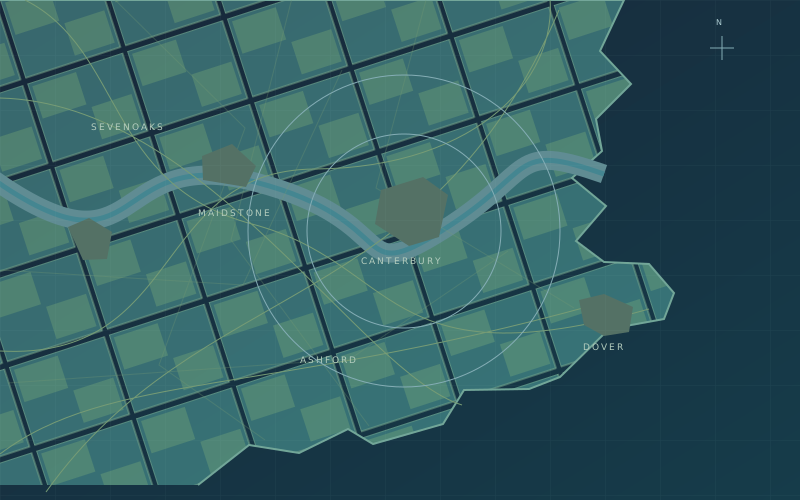
Flood maps make complex information feel immediate. A location appears inside or outside a coloured area, and the temptation is to treat that distinction as the answer. In practice, a map is an interpretation of data and assumptions. Understanding those assumptions is part of using it well.
Identify the hazard being shown
River flooding, surface-water flooding, coastal flooding, and groundwater flooding involve different mechanisms. A map of one does not automatically describe the others. Check the dataset’s scope, publication date, resolution, scenario, and treatment of defences. A useful legend explains units and categories, not just colours. Missing coverage should not be read as absence of risk.
Look beyond the site boundary
An asset may depend on access roads, substations, suppliers, or staff travel routes outside its immediate footprint. Conversely, local building characteristics or protective measures can change how mapped exposure translates into disruption. Bring the map into a conversation with people who know the site. Record whether their evidence confirms, qualifies, or challenges the initial interpretation.
Keep probability language precise
An annual probability is not a timetable. An event described using a return period does not have to wait a fixed number of years before recurring. Avoid translating technical categories into simple assurances such as ‘safe’. For an actual property or an urgent situation, use the relevant official information and qualified local advice.
Three things to take away.
- Check which flood mechanisms a map covers.
- Review dependencies outside the mapped footprint.
- Treat map screening as the start of investigation.
Further reading
Explore the underlying topics through these reference sources.